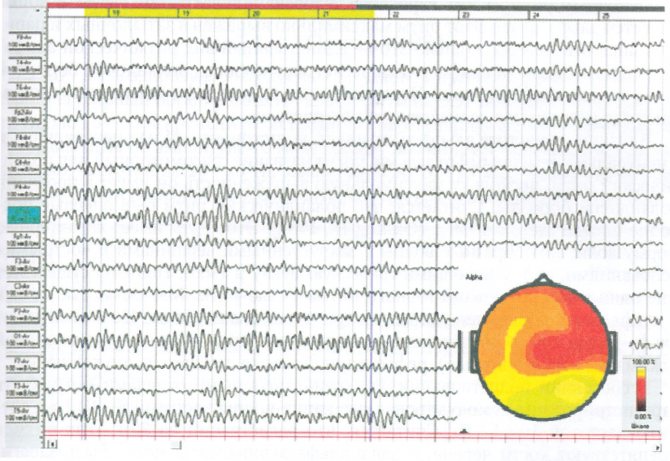
Rice. 1. Alpha pattern EEG modulated into a “spindle” rhythm with a frequency of 10 Hz, maximally expressed in the occipital leads and demonstrating a pronounced frontooccipital amplitude gradient. On the right side: topogram of alpha rhythm distribution by power, the epoch of analysis is marked with two markers
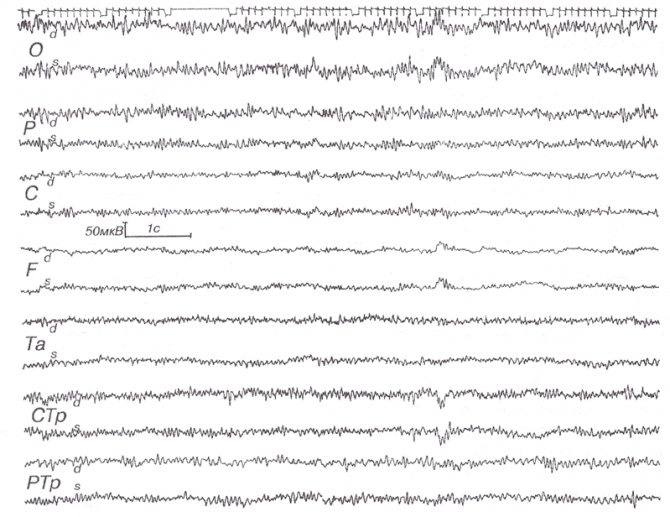
Subject to standard recording conditions (closed eyes, a state of quiet wakefulness, emotional comfort, absence of external stimuli), the majority (85-90%) of healthy adults normally register an alpha pattern on the EEG, which is an organized alpha rhythm, clearly modulated in spindles with an amplitude from 40 to 60–80 μV (Fig. 1).
The waveform is correct sinusoidal: not “sharpened”, not distorted by the asymmetry of the ascending and descending phases. On a normal EEG, the alpha rhythm occupies up to 80-90% of the recording time (rhythm index), occasionally interrupted by episodes of fast-wave activity, apparently in connection with the subject’s own mental (mental) activity.
The alpha rhythm is maximally represented in the parietal and occipital regions of both hemispheres. The distribution of the alpha rhythm is markedly zonal: its amplitude and frequency gradually decrease from the back of the head to the central and frontal regions of the brain. In the frontal leads, a weakly expressed low-amplitude unmodulated alpha rhythm is recorded, occupying no more than 50% of the recording time, alternating with periods of recording low-frequency beta activity comparable to the alpha rhythm in amplitude. In the temporal leads, an alpha rhythm not modulated in the spindle is recorded, usually with a smaller amplitude than in the central leads. Slow waves are practically not represented in all leads.
Symmetry, albeit relative, is so characteristic of a normal EEG that it is one of the criteria for assessing the functional state of the brain. Normally, the asymmetry in amplitude does not exceed 30%. Frequency interhemispheric asymmetry should not be more than 1 Hz. Naturally, there must be complete confidence in the identity of the installation of electrodes over both hemispheres. A consequence of the functional asymmetry of the brain, associated in most people with the predominance of activity of the left (dominant) hemisphere, is a certain predominance in the amplitude of the alpha rhythm in the right (!) hemisphere. It is believed that the left hemisphere is more closely connected with the activating mesencephalic structures of the brain, and the right - with the synchronizing diencephalic structures.
Mechanisms of formation of normal EEG

Rice.
2. Variants of normal EEG 1 - the most common type of EEG, 2 - moderately reduced EEG amplitude; 3 - low-amplitude EEG.
Normal waking EEG depends on mechanisms that determine the level of functional activity of the entire brain. The features of these systems are their midline location in the brain, synchronization of activity in the two hemispheres at all subcortical levels, as well as the diffuse and symmetrical connection of these systems with the cortex (see Fig. 2). As a result, the EEG is essentially homogeneous for the entire brain and symmetrical. It should, however, be noted that, despite the diffuse nature of the influence of the midline brain structures on the higher levels, the functional and morphological heterogeneity of the cortex leads to certain and significant features of the electrical activity of various brain regions. However, due to a fairly gradual transition from one functional zone of the cortex to another, the change in EEG types inherent in individual areas of the brain occurs gradually along the length of the cortex.
Symmetry is so characteristic of a normal EEG that it is one of the essential diagnostic criteria. In practice, an EEG in which the asymmetry value is no more than 50% of the amplitude of the compared recordings can be considered a normal variant. Naturally, there must be complete confidence in the identity of the installation and switching of the electrodes in both hemispheres.
Types of human brain activity recorded during EEG recording
The main types of activity that are recorded during the procedure and subsequently subjected to interpretation and further study are wave frequency, amplitude and phase.
Frequency
The indicator is estimated by the number of wave oscillations per second, recorded in numbers, and expressed in a unit of measurement - hertz (Hz). The description indicates the average frequency of the activity being studied. As a rule, 4-5 recording sections with a duration of 1 s are taken, and the number of waves in each time interval is calculated.
Amplitude
This indicator is the range of wave oscillations of the eclectic potential. It is measured by the distance between the peaks of waves in opposite phases and is expressed in microvolts (µV). A calibration signal is used to measure the amplitude. If, for example, a calibration signal at a voltage of 50 µV is determined on a record with a height of 10 mm, then 1 mm will correspond to 5 µV. In deciphering the results, interpretations are given to the most common meanings, completely excluding rare ones.
Phase
The value of this indicator evaluates the current state of the process and determines its vector changes. On the electroencephalogram, some phenomena are assessed by the number of phases they contain. Oscillations are divided into monophasic, biphasic and polyphasic (containing more than two phases).
Rhythms of brain activity
The concept of “rhythm” in the electroencephalogram is considered to be a type of electrical activity related to a certain state of the brain, coordinated by appropriate mechanisms. When deciphering the EEG rhythm indicators of the brain, its frequency corresponding to the state of the brain region, amplitude, and its characteristic changes during functional changes in activity are entered.
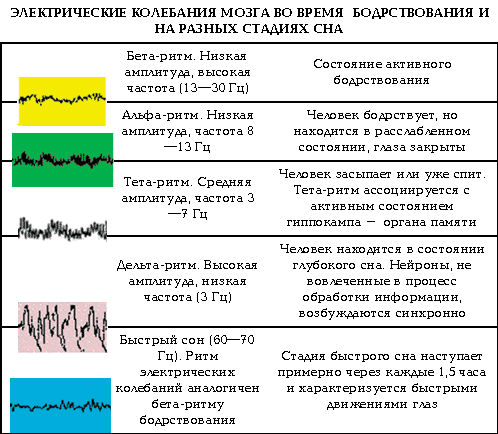
Characteristics of brain rhythms depend on whether the subject is awake or asleep
The role of the alpha rhythm in normal EEG
The alpha rhythm is recorded on the EEG in a state of quiet wakefulness, with eyes closed and in the absence of external sensory influences. Any nonspecific activation: opening the eyes, a flash of light, a tonal click, active mental activity - causes blockade of the alpha rhythm and a desynchronization reaction on the EEG. Normally, the blockade of the alpha rhythm should be complete, that is, there should be a complete reduction of alpha activity and its “replacement” with fast-wave low-amplitude oscillations, and simultaneously in all leads in which the alpha rhythm was recorded. When the eyes are closed again, the original alpha pattern should be restored within 0.3-1.0 s. High reactivity is one of the essential signs of a normal alpha rhythm.
The described alpha pattern represents the so-called “ideal norm” on the EEG. This textbook version is not always recorded. Variants of the alpha pattern can be characterized by a smoothed zonal distribution of the alpha rhythm, when the amplitude gradient is not so pronounced, and alpha activity remains quite pronounced in the anterior regions of the brain. There may be decreased modulation of alpha spindles. When the alpha rhythm index decreases, either slow wave activity or beta-1 activity can be recorded. At the same time, the alpha rhythm index remains quite high (more than 60-70%), and the amplitude of other components does not exceed half the amplitude of alpha waves. All of the listed EEG changes are interpreted as normal variants.
Thus, in the vast majority of healthy adults examined under standard conditions with their eyes closed, an organized alpha pattern is recorded on the EEG, reflecting the balanced state of synchronizing and desynchronizing systems for generating bioelectrical activity. The representation of this type of activity in the population, according to the results of various studies, is estimated at levels from 60 to 80-90%.
"Flat" EEG
Rice.
3. “Flat” EEG In 10-20% of healthy subjects, it is not possible to register the alpha pattern. There is practically no regular organized alpha rhythm on the EEG. About 10-20% of the time, irregular alpha activity is recorded, not exceeding 10 μV in amplitude. The EEG is dominated by beta activity, usually with a frequency of up to 20-25 Hz and an amplitude of up to 10-15 μV. The characteristic type of such activity made it possible to designate the pattern as a “flat” EEG, and the type of EEG is called low-amplitude (Fig. 3).
A “flat” EEG is a variant of the normal state of bioelectrical activity. Nevertheless, differentiating such a pattern from pathological types, for example, from diffuse tachyarrhythmia with severe atherosclerotic lesions of cerebral vessels, is, of course, not an easy task. A “flat” EEG is assessed as a variant of the norm, provided that pathological processes in the central nervous system are excluded.
More about the encephalogram
The essence of the examination is to record the electrical activity of neurons in the structural formations of the brain. An electroencephalogram is a kind of recording of neural activity on a special tape using electrodes. The latter are attached to areas of the head and record the activity of a certain area of the brain.
The activity of the human brain is directly determined by the work of its midline formations - the forebrain and the reticular formation (connecting neural complex), which determine the dynamics, rhythm and construction of the EEG. The connecting function of the formation determines the symmetry and relative identity of signals between all brain structures.
The structure of the brain, based on these data, the specialist deciphers the diagnosis
The procedure is prescribed if there are suspicions of various disorders of the structure and activity of the central nervous system (central nervous system) - neuroinfections such as meningitis, encephalitis, poliomyelitis. With these pathologies, the activity of the brain changes, and this can be immediately diagnosed on the EEG, and in addition, the localization of the affected area can be established. An EEG is carried out on the basis of a standard protocol, which records measurements taken while awake or asleep (in infants), as well as using specialized tests.
The main tests include:
- photostimulation - exposure of closed eyes to bright flashes of light;
- hyperventilation - deep, rare breathing for 3-5 minutes;
- opening and closing eyes.
These tests are considered standard and are used for encephalograms of the brain in adults and children of any age, and for various pathologies. There are several additional tests prescribed in individual cases, such as: clenching your fingers into a so-called fist, staying in the dark for 40 minutes, depriving yourself of sleep for a certain period, monitoring night sleep, and passing psychological tests.
These tests are determined by a neurologist and are added to the main tests performed during the examination when the doctor needs to evaluate specific brain functions.
Low amplitude EEG
Low-amplitude EEGs, according to modern data, indicate the predominance of desynchronizing influences in the brain. This type of EEG is associated with an autosomal dominant gene and is formed gradually during maturation. It is observed extremely rarely before the age of 201. The idea that this variant of the EEG is associated with desynchronization and, accordingly, with the predominance of activating ascending nonspecific systems is consistent with some data from psychological studies. It has been shown that low-amplitude EEGs correlate with increased behavioral activity, a tendency toward independence, aggressiveness, and increased mental excitability, while high-amplitude EEGs are characteristic of individuals of the passive, dependent, receptive, and calm type23. Thus, low-amplitude EEGs are a normal variant. It should be noted, however, that with some types of disorders in the region of the lower and middle brainstem, flattening of the EEG also occurs, introducing certain difficulties in the clinical assessment of these curves.
Features of the event
This research method is considered a highly effective technique for clarifying pathological processes in the brain and allows for an accurate diagnosis.
Purpose of diagnosis:
- Assessment of the period of wakefulness and sleep;
- Dynamics of therapy;
- Localization of the inflammatory focus;
- Detection of pathological changes.
Recording the results of a child’s EEG is possible both at rest and with various tests:
- Recording the results in a state of sleep (background curve of brain neuron impulses);
- Activation of brain structures during the transition from a resting state to an activity mode (the diagnostician tells you at set intervals when it is necessary to open and close your eyes);
- Application of the test - hyperventilation (the patient, at the command of the diagnostician, deeply inhales and exhales). This test is capable of identifying neoplasms and hidden epileptic signs;
- Diagnostics using photostimulation (a lamp with a given rhythm is turned on and off in front of the child, the eyes are closed during the test). This test evaluates the reaction to a stimulus in cases of mental and speech development disorders. It is also used for epilepsy and convulsive syndrome.
An EEG of the brain in children can be carried out by diagnosing impulses at night, or using the method of night sleep deprivation (the child is not allowed to sleep for a long time, with further recording of brain activity during rest), but this test is prescribed extremely rarely.
From the editor: Symptoms, causes and treatment methods for neuralgia
The algorithm for performing EEG on young patients is mainly determined by their age. Thus, babies up to one year old lie in their mother’s arms or are placed on a changing table during the study.
It is very important that the child sleeps during diagnostic monitoring. If the baby is naughty, you must first calm him down and wait until he falls asleep
An EEG session usually lasts no more than 20 minutes. The purpose of the study is to record the BEA of the child’s brain in a calm state. For older children, more complex diagnostic techniques may be added, such as functional tests of various types.
It is necessary that the examinee sit on the couch in a reclining position during diagnosis. The head should not lean forward, otherwise the received materials may be unreliable. The diagnostic room staff and parents should carefully monitor the little patient’s condition so that he is comfortable and can completely relax.
The standard encephalography procedure for a child over one year of age who is able to follow the doctor's instructions consists of the following steps. The first recording is the “background curve”, which shows the BEA at rest. Then functional tests are carried out to track pathological changes when changing occupation.
EEG changes in the wake-sleep cycle
➥ Main article: Sleep: EEG diagnosis of sleep disorders
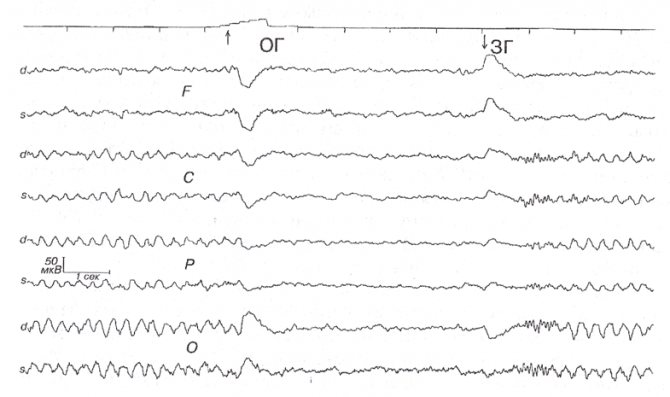
Since the EEG is associated with systems that determine the level of functional activity of the brain, it is possible to establish a certain correspondence between the nature of the EEG and the functional state of the brain. In most healthy people, a clear correlation is found between the level of functional activity of the brain in the wakefulness-sleep cycle and the amplitude-frequency characteristics of the EEG. A decrease in the level of wakefulness (transition from functional rest to sleep) is accompanied by a slowdown in the frequency and increase in the amplitude of EEG waves, and an increase in the level of activity (transition from a state of rest to psycho-emotional stress) correlates with an increase in the frequency of activity (Fig. 4).
Sleep phases
The sleep of a healthy person is a cyclic repetition of successively changing phases. There is a phase of slow (orthodox) sleep and a phase of rapid (paradoxical) sleep. NREM sleep occurs immediately after a person falls asleep. Its duration is 80-90 minutes. The formation and development of slow sleep is ensured by the anterior parts of the hypothalamus, raphe nuclei, nonspecific nuclei of the thalamus and the middle part of the pons (the so-called Moruzzi inhibitory center). There are three stages in the structure of slow-wave sleep. The stages of sleep differ in the depth of sleep, which can be conventionally measured by the intensity of an external stimulus that can cause awakening (Fig. 5).
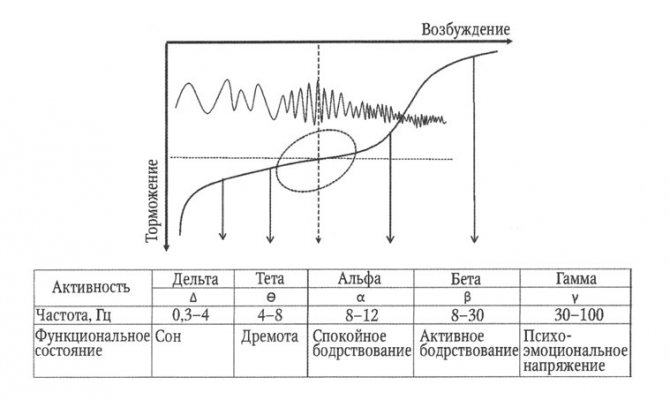
Rice. 4. Reflection in EEG parameters of the main nervous processes: excitation and inhibition.
In the diagram, the alpha rhythm corresponds to a state in which the processes of excitation and inhibition are balanced in strength (zone marked by an ellipse)
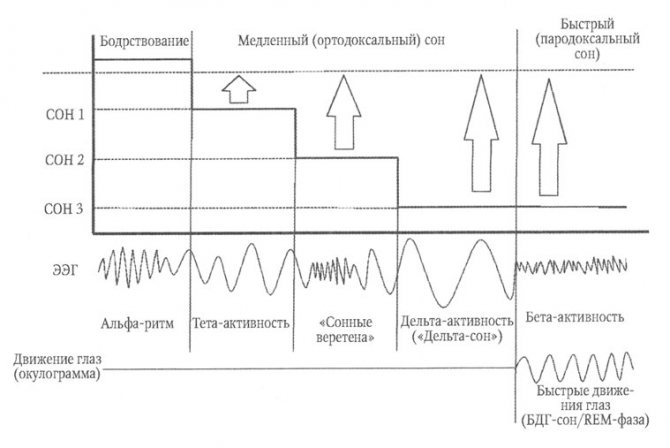
Rice. 5. Sleep structure.
The arrows schematically indicate the intensity of the stimulus that can cause awakening, as an indirect reflection of the depth of sleep. REM sleep is not inferior in depth to the third stage of sleep, which determines the paradoxical nature of the state: deep sleep against the background of fast-wave activity on the EEG and rapid movements of the eyeballs
Stages of sleep
During the first stage of slow-wave sleep, a person is in a state of drowsiness or half-asleep. The alpha rhythm slows down, transforming into a low-amplitude theta rhythm. Muscle activity decreases, heart rate and breathing decrease, metabolic processes slow down, and the eyeballs move slowly.
In the second stage of sleep (light and shallow sleep), against the background of predominant theta activity, low-amplitude sigma rhythm oscillations with a frequency of 12-14-16 Hz appear, which are described as “sleep spindles” . For this reason, the second stage of sleep is called “sleep with spindles.” The second stage is up to approximately 55% of the total sleep time.
In the third stage of slow-wave sleep, the EEG pattern is dominated by delta activity of medium and high amplitude. The third stage is called delta sleep. Its depth is maximum; it is extremely difficult to wake a person during delta sleep. The third stage accounts for about 10% of all sleep time. Slow-wave sleep ensures complete restoration of the energy expended during the day.
REM-sleep
Normally, during sleep, a person experiences episodic periods during which a drop in muscle tone is observed with the simultaneous appearance of rapid saccadic movements of the eyeballs and sometimes rapid movements of the limbs. During this period, the sleeper can be awakened by external stimuli with an intensity no less than during the deep sleep phase. During these periods, the EEG records polymorphic activity with a predominance of high frequencies. Research has shown that these periods correspond to the subjective experience of a dream. Thus, this stage of sleep is distinguished by a number of manifestations that contradict each other: activation on the EEG indicates the transition of the brain to a higher functional level, which contradicts the large depth of sleep measured by the intensity of the awakening effect; a high level of subjective emotional and mental experiences in a dream contradicts muscle relaxation. In this regard, the described phase of sleep is called paradoxical , or “rapid eye movement sleep ,” abbreviated as REM sleep (rapid eye movement). The phase of paradoxical sleep was first identified and described in detail in 1953 by Nathaniel Kleitman together with his student Eugene Aserinsky.
The facts accumulated in the electrophysiology of the central nervous system make it possible to link each EEG frequency range with sufficient reliability to a certain level of brain activity in the “deep sleep - psycho-emotional tension” continuum. The alpha rhythm is characteristic of a state of functional rest. During the transition to sleep, which reflects the development of inhibition, the alpha rhythm is replaced by slow rhythms, the frequency of which decreases in proportion to the depth of sleep, i.e., the strength of inhibition. An increase in the level of wakefulness during mental or physical activity is accompanied by an increase in the excitatory process, which is accompanied by blockade of the alpha rhythm and the formation of high-frequency rhythms, and the higher the level of wakefulness, the higher the dominant frequency on the EEG.
International Neurological Journal 8 (46) 2011
Introduction
It is known that none of the other types of electrical oscillations of the brain from 10–2 to 103 Hz has such functional significance in the processes of attention, memory, emotions and motivation as fusiform oscillations in the range of 5–15 Hz2 (Ivanitsky, 1997; Livanov 1989; Nunez et al., 2001).
It has been shown that the functional core that organizes the bioelectrical activity of the brain in other frequency ranges is formed by oscillations with alpha activity (Martñez-Montes et al., 2004; Klimesch et al., 2007). However, it has not yet been clarified what quantitative signs of the electroencephalogram characterize fluctuations of alpha activity: an increase or decrease in frequency, an increase or depression of amplitude, synchrony or desynchronization of the phases of oscillations, and in what frequency range they appear. In addition, due to the fact that it is not entirely clear what neurophysiological mechanisms underlie the phenomenon of alpha activity, it is difficult to interpret the psychological correlates of EEG signs of alpha activity, especially in a certain standardized frequency range. The purpose of this work is to determine, based on an analysis of modern literature data and the results of our own experiments, what is the nature of alpha activity, what EEG signs characterize it and what their psychophysiological significance is.
The phenomenon of “EEG alpha activity”
In 1966, Gray Walter suggested that there is a wide variety of alpha rhythms that differ in amplitude depending on the localization in the cortex, the presence or absence of amplitude blockade during eye opening or during mental stress (Walter, 1966). For frequency components of this type of EEG, the expression “family of alpha rhythms” is used, which includes: a) the classic parieto-occipital visual alpha rhythm (Adrian & Mathew, 1934; Kirschfeld, 2005); b) a rhythm sensitive to proprioceptive stimulation, called either rollandic (Zenkov, 1996), or sensorimotor (Sterman, 1996), or mu (Guselnikov and Iznak, 1983; Muthukumaraswamy et al., 2004), or temporarily appearing “third” ( Neidermayer, 1993–1997), or lambda rhythm (Schomer, 2007); c) sleep spindle waves (Ishii & Dziewas, 2001; Nunez et al., 2001). Castro-Alamancos et al. prefer not to use the terms “alpha waves” or “sensorimotor rhythm”, referring to such oscillations as “approximately ten-Hz oscillations of the motor cortex” (Castro-Alamancos et al., 2007). Recently, rhythmic alpha-like brain activity in unusual ranges was described by Hong Kong Fong researchers at slow (4–5 Hz) and fast (16–20 Hz) EEG frequencies (Fong & Fong, 2001). Chapman and Lacaille refer to the 4–12 Hz rhythm recorded in the hippocampus as the theta rhythm (Chapman & Lacaille, 1999), and Moretti et al. refer to the same frequency range recorded in the occipital regions as the alpha rhythm (Moretti et al., 1999). 2004). The very existence of a family of alpha rhythms without clearly defined frequency and topographic boundaries leads to the assumption that not only the amplitude and power of oscillations in a certain standard range characterize alpha activity, but also an individual combination of several physical characteristics of the wave process, which has a clearly defined physiological significance.
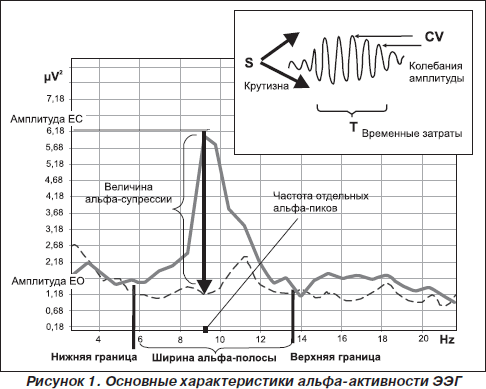
Initially, Hans Berger (1873–1941) defined alpha activity as: 1) the rhythmic component of the EEG, the frequency of which lies between 8 and 12 Hz; 2) oscillations with the greatest amplitude in the occipital region of the cortex, which decrease in amplitude with eye opening and any cognitive load (Adrian & Matthews, 1934). In 1979, a group of Czech researchers, when analyzing the effectiveness of alpha-stimulating biofeedback training, found that amplitude dominance in the parieto-occipital region could be a criterion for assessing alpha activity only if the length of the alpha spindle was simultaneously assessed (Lansky & Bohdaneck, 1979 ). Theoretical calculations (Osovets, 1983; Rusinov et al., 1987; Hooper, 2005; Kirschfeld, 2005–2008; Tenke & Kayser, 2006) and analysis of the molecular cellular mechanisms of alpha oscillation generation (Sherman & Guillery 2006; Steriade et al. , 2001; Timofeev & Bazhenov, 2005) gave reason to believe that one of the most informative phenomenological characteristics of alpha activity is the autorhythmicity or fusiform organization of these waves (Livanov, 1989; Kaplan, 2005, Timofeev & Bazhenov, 2006).
Thus, in modern literature, the term “alpha rhythm” is applied to any EEG components with the following characteristics: 1) the frequency of the dominant EEG rhythm in the parieto-occipital region; 2) spindle-shaped oscillations and 3) a decrease in amplitude during the reaction of visual and cognitive activation (Livanov, 1989; Barry et al., 2007; Klimesh et al., 2007; Nunez et al., 2001; Thatcher et al., 2008) (Fig. . 1).
The nature of alpha oscillations
It is obvious that the above phenomenological characteristics of alpha activity are due to the unique nature of alpha oscillations. Describing the nature of the wave process presupposes elucidating the source of its generation. In 1968, P. Andersen and S. Andersson came to the conclusion that the thalamic nuclei are the primary generator of all types of rhythmic fusiform brain activity (Andersen & Andersson, 1968). Since then, researchers have added to the hypothesis of a thalamic source of generation of alpha oscillations only that spindle-shaped electrical waves arise in various nuclei of the thalamus approximately once every 100 ms, which, through thalamocortical fibers, form the rhythmic activity of the corresponding cortical areas, the so-called cortical twins (Andersen & Andersson , 1968; Jones et al., 2000; Contreras et al., 1997; Sherman SM, Guillery RW), and that these wave bursts in each cortical area are controlled by a specific thalamic nucleus (Hughes & Crunellia, 2007; Schreckenberger et al., 2004 ). What distinguishes the thalamic relay cells in which these waves originate from other neurons is the increased density of calcium T channels on cell surface membranes and the endoplasmic reticulum (Berridge et al., 2003; Sherman & Guillery, 2006). It has been established that T-type calcium channels, by regulating the calcium concentration, can inhibit the transmission of the activation signal through the thalamus and thereby stabilize the resting state (Page et al., 2006). The intracellular calcium current produces a temporary depolarization of the cell membrane with a frequency of approximately 10 times per second, since the refractory activation of calcium channels is approximately 100 ms (that is, this is the frequency of alpha waves). These experimental data confirmed the hypothesis put forward by M.N. Livanov in the middle of the 20th century and later by Nobel Prize winner J. Eccles, that the organization of the rhythmic activity of the brain is due to the refractory properties of calcium current excitation, which determine the frequency of the rhythmic discharge of neurons (Livanov, Eccles, 1994). Thus, the frequency of changes in calcium concentration in the cytoplasm of a neuron is a key element in changes in the frequency of alpha activity in the brain (Luthi et al., 1998).
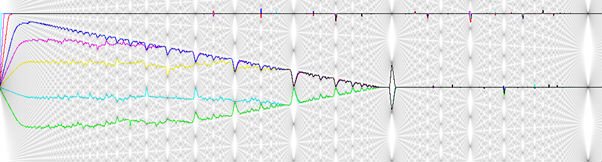
1. Alpha rhythm frequency. The heritability of the frequency of the dominant EEG rhythm and its interindividual typological variability have been proven by many studies (Anokhin et al., 2006; Nunez et al., 2001; Smit et al., 2006; Thatcher et al., 2008). Moreover, among different indicators of the frequency of alpha activity (average, weighted average in the alpha range and the frequency of the maximum peak), only the individual frequency of the maximum peak reflects a single aggregate resource of alpha activity, and the frequencies of other spectral peaks from the range of oscillations that have alpha activity are determined the intensity of the stimulus and the duration of its impact (Hooper, 2005). Greg Hooper theoretically calculated that the statistical behavior of the individual frequency of the maximum alpha peak at rest is most consistent with the laws of the normal distribution compared to the average frequency and weighted average in the alpha range (Hooper, 2005). Our data experimentally confirm this position (Bazanova, 2010). Indeed, the individual frequency of the maximum spectral peak of the alpha rhythm in the posterior parts of the brain at rest with eyes closed is an invariant indicator, highly reproducible in test-retest studies and is 10.0 ± 0.5 Hz in most individuals 25–40 years old ( Bazanova, 2008a, Bazanova, 2011; Kaiser, 2005; Nuwer, 2003; Thatcher et al., 2008). The most likely reason for the genetic determination of alpha frequency is the structural organization of calcium channels, which determines the frequency of alpha oscillations (Anderson et al., 2005). The connection between the frequency of generation of spindle-shaped alpha oscillations and the structural carriers of genetic information - nucleic acids - was demonstrated in 1965 by M.B. Stark (Stark M.B, 1965). It turned out that individuals who differ in the frequency of the maximum peak of alpha activity are characterized by different behavioral strategies (Bazanova & Aftanas, 2006; Jin et al., 2006; Regehr & Kaplan, 1988). However, along with this, intra-individual variability in the frequency of the maximum alpha peak has been established depending on age factors (Stroganova and Tsetlin, 1998; Bazanova, 2008a; Clarck et al., 2001), neurohumoral status (Bazanova et al., 2008b; Creutzfeldt et al., 1976; Kamijo & Murakami, 2009; Korol, 2004; Tops et al., 2006), the nature of the psychopharmacological effect (Tops et al., 2006), the severity of fatigue processes (Kamei et al., 2000) (Fig. 2 and 3) . At the same time, fluency in performing cognitive (Doppelmayr et al., 2005; Klimesh et al., 2007; Moretti et al., 2007) and psychomotor tasks (Bazanova et al., 2008; Hummel et al., 2004), as well as the degree of proficiency professional skills (Bazanova et al., 2008; Kuraev et al., 2006) are higher in individuals with high (> 10 Hz) than with low (< 10 Hz) alpha frequency. The above intra-individual fluctuations of alpha frequency are due to the influence of epigenetic factors, carried out either through an effect on the activity of calcium channels (Riegel & Williams, 2008), or on the processes of phosphorylation of protein kinases involved in the biosynthesis of calcium channels (Koulen et al., 2008), or through the action of on the activity of neuronal receptors (Huang et al., 2007). Moreover, the mechanism for the formation of alpha oscillations transmitted through ionotropic receptors is different than through metabotropic receptors (Pin & Duvoisin, 1995) - blocking ionotropic receptors, through which spindle-like waves are generated, initiates the conduction of oscillations through metabotropic receptors (Lukatch et al., 2005). Metabotropic receptors, making up 90–95% of synaptic inputs, have a feedback projection in the sixth layer of the cortex and in the brainstem reticular formation (Pin & Duvoisin, 1995). This explains their key role in the processes of inhibition or so-called top-down control (Klimesh et al., 2007). Thus, recent studies by P. Emson have demonstrated that in knockout mice for the subunits of metabotropic GABA-B receptors, as expected, the processes of their inhibitory effect on the activity of calcium channels are disrupted; accordingly, there is no refractory period, the frequency increases and the spindle shape of alpha is disrupted. oscillations (Emson, 2007).
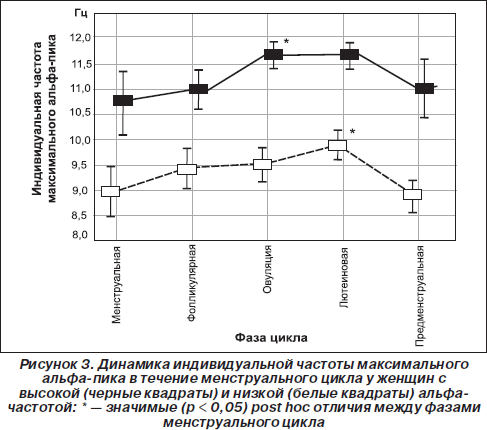
Interestingly, the frequency of neuronal oscillations itself can influence membrane conductance and the sensitivity of receptors to neurohumoral stimuli (Chi Ping et al., 2003; Destexhe & Sejnowski, 2003). Thus, Chi Ping and co-authors showed that the process of estrogen activation of a specific Ca2+-calmodulin-dependent protein kinase, which affects the frequency of fluctuations in calcium concentration, linearly depends on the frequency of incoming impulses (Chi Ping et al., 2003). This may be why an increase in individual alpha frequency during ovulation (when there is a sharp increase in estrogen concentrations) is observed only in women with a high (≥ 10 Hz) alpha frequency. And in women with a low (< 10 Hz) alpha frequency, an increase in the frequency of the maximum peak occurs only in the luteal phase (Fig. 3), which is most likely due to an increase in progesterone concentration (Baker et al., 2007; Bazanova et al., 2008b ; Creutzfeldt et al., 1976). Another example of the fact that intra-individual fluctuations of the alpha frequency manifest themselves differently depending on the alpha-frequency EEG pattern is the effect of age: a decrease in the individual frequency of the alpha peak after forty years occurs only in low-frequency subjects, but is not observed in high-frequency subjects (Bazanova, 2008a). This decrease is more pronounced the more cognitive abilities weaken (Clarck et al., 2004) and blood pressure increases (Bazanova, 2008a) (Fig. 3).
Thus, the basis of intra-individual variability in the frequency of the alpha peak is the mechanisms of molecular and structural-receptor organization of impulse generation and conduction. At rest, the individual frequency of the maximum alpha peak of the EEG reflects genetically determined features of the structural and molecular organization of neurons, and the intra-individual variability of this indicator reflects changes in cortical-thalamic and neurohumoral interactions, which, in turn, depend on the level of the individual frequency at rest.
The question arises: are genetically determined differences in individual frequency of the maximum peak reflected in other characteristics of alpha activity?
2. Spindle-shaped (autorhythmic) alpha oscillations reflect the ability of neuronal populations to self-tuning or “phase modulation” - adjusting the frequency of oscillations of a given neuronal ensemble to the frequency of another, and thereby coordinating their activity (Livanov, 1989; Osovets, 1983). CM. Osovets et al. (1983), based on theoretical calculations, suggested that the interaction of a number of such oscillators leads to amplitude and frequency-phase modulation, therefore the alpha rhythm spindles are irregular and their duration varies within a fairly wide range (Osovets, 1983; Kirschfeld, 2005 ; Lebedev and Lutsky, 1972; Kaplan et al., 2002). In this case, the connections between individual oscillators within a given frequency range are obviously such that the system has not yet entered the stochastic mode, but has already left the periodic one. This process is fully consistent with modern ideas about the existence of intermediate states during the transition from a periodic to a stochastic process (or, in the language of hydrodynamics, from a laminar flow to a turbulent one) (Osovets, 1983; Kirschfeld, 2005), which is a consequence of the different transmission of impulses generated by volley or tonic type (Sherman & Guillery, 2006). Because volleys or fusiform waves are better recognized by the cortex and cause cortical activation, they are represented as wake-up calls to the cortex, which can be useful for automatically performed actions (Steriade, 2001). Once attentional processes are engaged, tonic priming begins to operate in order to maximize the seamless transmission of information along the thalamo-cortical-thalamic circuits (Sherman & Guillery, 2006). Based on experimental data, I. Timofeev and M. Bazhenov came to the conclusion that the ability of cells to produce spindle-shaped oscillations depends both on the type of cell and on the conditions under which these oscillations are generated (Timofeev I., Bazhenov, 2005; Berridge et al. , 2003).
Until recently, it was assumed that sleep spindles and alpha spindles were completely different phenomena (Lopes da Silva, 1991, Steriade et al., 1990). Recent work, however, has shown that the burst type of oscillation generation is observed not only during sleep, but also during wakefulness (Sherman & Guillery, 2006). On the one hand, spindles are associated with inhibitory processes in the thalamus and can be considered as an input mechanism for blocking the process of processing information from the external world (Bazhenov et al., 2000; Berridge et al., 2003), and on the other hand, on the contrary, they play the role of a probe or a controlling mechanism of communication between the organism and the environment (for example, fusiform electrical activity of the brain, observed once a day in hibernating animals (Stark, 1970)).
Thus, the presence of well-defined alpha spindles on the EEG indicates the well-functioning of the adaptive mechanisms of ascending and descending control (Giesbrecht et al., 2006), and their disappearance signals disturbances in the control mechanisms of sensorimotor integration in patients with spinal injuries in the absence of afferentation (Middleton et al. al., 2004) or in manic-depressive syndrome of the schizoid type (Kaplan et al., 2005). Our results suggest that success in training optimal psychomotor functioning using biofeedback is correlated with increases in alpha spindle duration and amplitude (Bazanova et al., 2008c). As expected, due to differences in the formation of spindles with different types of generation and, accordingly, different pulse frequencies, we note a U-shaped dependence of the duration of spindle segments on the individual alpha frequency. The shortest spindles are observed in individuals with extremely low and extremely high alpha peak frequencies (Fig. 4). The same subjects with individual alpha peak frequency values that deviate most from the average level are characterized by the highest rates of originality in solving tasks in the Torrance test (Bazanova and Aftanas, 2007). A similar inverted U-shaped dependence of the average spindle length of the alpha rhythm on its dominant frequency was noted by A.N. Lebedev and his collaborators (Maltseva and Masloboev, 1996). Longer alpha spindles are hypothesized to indicate greater emotional stability and balance in individuals ( Bazanova and Aftanas, 2007 , Lebedev et al., 2002 ). According to A.N. Lebedev, such people are more friendly and less dominant in interpersonal communication (O. Leary test), are characterized by greater flexibility of thinking, ease of switching from one type of activity to another and a desire for a variety of forms of activity (Lebedev et al., 2002). It is interesting that in individuals with different frequencies of alpha activity at rest with their eyes closed (that is, with different molecular genetic mechanisms of generation and transmission of impulses), spindles are formed and live due to different mechanisms, that is, the same alpha spindle duration correlates with different EEG characteristics (Bazanova et al., 2008c): in subjects of the low-frequency group, the longer the spindle duration, the greater the variability of the amplitude within the spindle, and in the high-frequency group, the wider the frequency range included in the activation reaction. As for another microstructural characteristic of the spindle - amplitude variability, which indicates a more intense process of phase rearrangements (Oprisan et al., 2004), it was found that the highest coefficient of variability and a wider alpha frequency range on the resting encephalogram are observed in individuals characterized by higher Torrance coefficients of nonverbal creativity (Bazanova and Aftanas, 2007–2008), as well as in musicians with the highest level of performing skills (Bazanova et al., 2003).
Thus, the most important feature of alpha oscillations is their fusiformity, or high phasic variability, reflecting the dynamics of the ensemble organization of cortical neural activity. In this case, 1) the duration of the spindle correlates with the lifespan of the neural ensemble, which can serve as a marker of cognitive performance and emotional stability; 2) intra-segment amplitude variability or the intensity of phase restructuring within the ensemble corresponds to the search for optimal conditions for controlling the processes of ascending and descending information and indicates the level of creativity; 3) the steepness of intersegment transitions allows one to judge the rate of formation or decay of neural ensembles.
Finally, the third functional feature of alpha oscillations, which was described back in 1934 by E. Adrian and B. Matthews, is a decrease in the amplitude of alpha waves in response to eye opening, called the Berger effect (Adtian & Matthew, 1934). Robert Barry proposed to use the term “activation” to refer to the reactivity of the alpha rhythm to visual stimulation (Barry et al., 2007). The depth of the decrease in EEG alpha amplitude is taken as the intensity of activation (Barry et al., 2007) (Fig. 1). It has been established that the strength of the activation reaction is less in subjects at rest compared to conditions under which the process of internal information processing is necessary (Cooper et al., 2006). Since it has been shown that long-term visual stimulation not only causes an action potential, but also reduces the sensitivity of neurons to light (Kirschfeld, 2008; Lansky et al., 1979), the duration of alpha amplitude suppression upon eye opening is one of the informative signs of the stability of the activation response. and, together with the depth of desynchronization, correlates with the effectiveness of intellectual activity (Shmelkina, 1999; Stipacek et al., 2003). It is not surprising that a number of researchers use indicators of amplitude suppression in response to eye opening as individual typological signs related to both general adaptability (Arikan et al., 2006; Bazanova et al., 2003) and the formation of changes in cognitive activity (Alexander et al., 2006; Stipacek et al., 2003) and success in learning using adaptive feedback (Bazanova et al., 2007; Shmelkina, 1999). Just like other characteristics of EEG alpha activity, the activation process, on the one hand, is largely determined by genetic factors (Malykh et al., 1998; Anokhin et al., 2006), and on the other, varies depending on age ( Anderson et al., 2005; Bazanova et al., 2008a), neurohumoral status (Bazanova et al., 2008b; Goldstein et al., 2005) and frequency of dominant alpha oscillations (Gebber et al., 1999; Mazaheri and Jensen, 2006). However, the assertion that alpha amplitude decreases only due to light stimulation becomes questionable when opening the eyes in a completely dark room is also accompanied by a decrease in alpha amplitude, and not only in the visual cortex (Klimesch et al., 2001; Toscani et al. , 2010). According to M. Moosmann et al., the decrease in alpha amplitude in a dark room does not occur due to primary sensory stimulation, but, more likely, reflects the descending control influence of the cortex (Moosmann et al., 2003). Amplitude depression depends linearly on receptor activity, stimulus magnitude, and, accordingly, generation type (Sherman & Guillery, 2006). Therefore, EEG responses to visual stimulation can be either additive or the result of phase rearrangement (David et al., 2005; Kirschfeld, 2005, 2008). We observe these different activation mechanisms in individuals with different resting alpha frequencies. Multiple regression analysis showed that the strength of the visual activation reaction in low-frequency subjects was greater, the greater the amplitude variability of the alpha spindle (i.e., the intensity of phase rearrangements), and in high-frequency subjects, the higher the amplitude of alpha oscillations (Bazanova et al., 2008c) .
Based on the foregoing, it can be assumed that studying the response to visual stimulation allows us to identify individual frequency components of the EEG that have alpha activity and which, accordingly, can be called the alpha rhythm. However, to date, the definition of frequency ranges has been carried out according to conventions and standards (Kaiser, 2004), which do not take into account the individual manifestations of the reaction of a decrease in amplitude in response to visual stimulation. Meanwhile, recent pioneering studies using combined EEG and f-MRI recordings have convincingly shown that episodes of spontaneous decreases in EEG alpha power in a state of physiological rest are associated with increased brain activity (Laufs et al., 2006). The authors of this and other similar studies suggest that the pattern of brain activation during alpha power decline depends on the background level of brain activity observed in the broader (not just standard alpha) spectral range of the EEG (Jones et al., 2000; Kaiser, 2005 ). The results of our studies also demonstrated that the individual width of the alpha range varies at the inter- and intra-individual level and depends on many factors: age, neurohumoral status, level of professional skill, etc. (Bazanova et al., 2008 a, b, c). Since the boundaries of the theta and beta frequency ranges of the EEG will be determined depending on the boundaries of the alpha band, taking into account the values of the individual width of the alpha band becomes especially relevant when conducting neurofeedback trainings organized using the power of not only alpha, but also theta and beta -EEG bands as feedback signals (Bazanova and Aftanas, 2007; Kaiser, 2005).
Thus, the characteristics of reactivity to visual stimulation—the depth and duration of the decrease in the power of alpha oscillations and the width of the range in which the activation reaction is noted—can serve as individual markers of alpha activity in the brain. Just like the duration of the alpha spindle, the strength of activation does not differ in average values among subjects with different individual frequencies of alpha oscillations, but it is caused by different mechanisms.
The neurophysiological mechanisms of alpha activity presented above and their relationship with cognitive and physiological functions give reason to believe that in order to quantitatively assess the alpha activity of the brain, it is necessary to find out at least the magnitude of three main EEG signs:
1) amplitudes and frequencies of dominant oscillations in the parieto-occipital region at rest with eyes closed;
2) autorhythmicity - according to the characteristics of the microstructure of the alpha spindle: intrasegment variability of amplitude, duration, average amplitude and the steepness of the spindle rise;
3) visual activation in terms of depth and stability of amplitude reduction, as well as the width of the frequency range in which activation occurs.
Obviously, the measurement of any individual characteristic, for example, frequency or amplitude, cannot claim to be a complete assessment of alpha activity, and an analysis of the individual parameters of EEG alpha activity taken together and their relationships can lead to elucidation of the peculiarities of the functioning of the psychophysiological mechanisms of behavior and adaptation.
Sex differences in EEG
There are certain sex differences in EEG. Women are characterized by higher a-rhythm frequencies and a greater amount of beta-activity. These data in a certain way correlate with gender differences in psychological characteristics, indicate a higher level of activation in women, obviously have a genetic basis and may be associated with hormonal characteristics4. It has been shown that in the premenstrual period there is an increase in the frequency of the a-rhythm, which correlates with an increase in psychometric indicators. During the same period, progesterone levels increase. Women taking hormonal contraceptives do not show such cyclicity on the EEG; they have lower psychometric indicators5.
What can be assessed with an EEG?
This type of examination allows you to determine the functioning of parts of the brain in different states of the body - sleep, wakefulness, active physical, mental activity and others. EEG is a simple, absolutely harmless and safe method that does not require disruption of the skin and mucous membrane of the organ.
Currently, it is widely in demand in neurological practice, since it makes it possible to diagnose epilepsy and highly identify inflammatory, degenerative and vascular disorders in the brain. The procedure also provides identification of the specific location of tumors, cystic growths and structural damage as a result of trauma.
EEG using light and sound stimuli makes it possible to distinguish hysterical pathologies from true ones, or to identify simulation of the latter. The procedure has become almost indispensable for intensive care units, providing dynamic monitoring of comatose patients.
The disappearance of eclectic activity signals on the EEG indicates the onset of death
Rare types of EEG
From a diagnostic point of view, some relatively rare types of EEG are of interest. Some healthy subjects do not have a normal a-rhythm, and instead, activity of 14-18 Hz is recorded. This activity has a maximum amplitude of about 50 μV in the occipital regions and, like the normal α rhythm, its amplitude decreases anteriorly. In response to afferent stimuli during mental stress and emotional stress, this rhythm disappears and an activation reaction occurs. All this allows us to consider the indicated activity as an equivalent of the a-rhythm and regard such EEGs as a variant of the norm (Fig. 6).
Rice. 6. Quick a-option.
Neurologically healthy V.N.K., 43 years old. Regular rhythm of 13-17 Hz with eyes closed with an amplitude gradient corresponding to the normal a-rhythm.
Rice. 7. Slow a-variant.
Woman F.E.A., 27 years old, with psychogenic headaches without organic neurological pathology. Regular rhythm of 3.6 Hz with eyes closed with an amplitude gradient corresponding to the normal a-rhythm. Opening the eyes (“OG”) causes a desynchronization reaction. When closing the eyes (“ZG”) after a short spindle of a-activity of 13-14 Hz, there is a transition to the “slow a-variant”. Characteristic artifacts of eye movements are visible when closing and opening them.
Finally, very rarely (about 0.2% of cases, according to I.Petersen, R.Sorbie, 1962) there are peculiar EEGs in which, with the eyes closed, regular, close to sinusoidal, slow waves with a frequency of 2.5 are recorded in the occipital regions -4 Hz and amplitude 50-80 µV. This rhythm disappears with afferent stimuli with the appearance of a typical reaction, like the a-rhythm. With open eyes, the EEG shows normal low-amplitude polymorphic activity in the range of the a- and beta-rhythm. Clinically, in these cases it is not possible to identify organic cerebral pathology, and the complaints are of a neurotic, functional nature. In our own observation, the patient, in addition to headaches, which were assessed as psychogenic as a result of a full clinical examination, complained of chronic insomnia (Fig. 7). It is therefore possible that this type of EEG could serve as a manifestation of a violation of the normal function of regulation of sleep and wakefulness. This kind of EEG should be considered as borderline between normal and pathological; according to I.Peterson, R.Sorbie6, they may indicate dysfunction of diencephalic nonspecific brain systems.
WHAT YOU CAN LEARN ABOUT FROM EEG
Medical statistics and specialist experience make it possible to decipher anomalies in EEG graphs and diagnose their causes.
Abnormal EEG characteristics indicating various pathologies:
- Signals from the neurons of the hemispheres are not consistent and asymmetrical;
- The basic rhythms have sharp frequency changes, corresponding to sudden bursts of activity or their sudden decline. The presence of frequency jumps indicates the presence of infection, tumors, traumatic injuries, or the development of a stroke.
- Alternation of pointed and basal loops, a large frequency spread, one-time or serial bursts may indicate epilepsy. But between attacks, EEG readings can be the same as those of a non-sick person.
- The appearance of δ- and θ-rhythms in a non-sleeping patient indicates brain abnormalities.
Violations of basic rhythms and pathologies:
- asymmetry of the α-rhythm in the hemispheres up to 30% indicates tumors or heart attack/stroke. Sometimes α-loops have high frequency values, accompanied by some instability, which indicates the presence of lesions due to traumatic brain injury. In senile dementia or due to injury, α-waves disappear or become asymmetrical. Deviations of the α-rhythm in children can be caused by a delay in the development of psychomotor skills.
- β-loops with an amplitude of 50 μV or more indicate a concussion. Short bursts of β waves indicate encephalitis. Their increasing frequency and duration are a sign of the inflammatory process.
- An amplitude of δ waves of more than 40 μV is a sign of abnormalities in brain activity. When this manifests itself in all areas, the cause is complex diseases of the central nervous system. In neoplasms, the δ rhythm is also characterized by large variations in fluctuations.
- Pronounced θ- and δ-peaks in the occipital part of the EEG of the brain in children indicate developmental delay.
Signs such as the absence of sharp peaks, synchrony and symmetry of rhythms in the hemispheres, the predominance of α- and β-rhythms in non-sleeping people, stability of brain signals under short-term light exposure, indicate normal brain activity in a healthy person.
EEG OF COMATOUS STATE
If the activity of the central nervous system is neutralized by potent drugs or the blood supply to the brain is disrupted, the EEG will record a partial or complete absence of activity. In fact, in this state the vital activity of the body is maintained artificially.
Provoking tests (activation procedures)
➥ Main article: Functional EEG tests
Provoking tests (or activation procedures) serve as an important component of the EEG in clinical practice and represent various types of stimuli or influences that can provoke disturbances in the EEG. Traditional practice is to carry out hyperventilation and rhythmic photostimulation (these tests provoke the appearance of slowing and/or epileptiform disorders, although it is possible to use other provoking tests - sleep deprivation, pharmacological and other methods.
Rice. 13. Normal increase in EEG amplitude (“accumulation” - build-up) during hyperventilation
Hyperventilation is typically performed for 3 to 5 minutes in most EEG laboratories. The goal is to achieve cerebral vasoconstriction through deep breathing, as a result of the development of systemic hypocarbia. Hyperventilation normally causes a bilateral increase in the activity of θ- and δ-frequencies (“accumulation” - build-up7) with a predominance in the frontal leads, often having a high amplitude. The cessation of this effect is normally observed within 1 minute. In patients with site-related epilepsy, activation or generation of epileptiform discharges is uncommon (<10%); however, this rate can be as high as 80% in patients with generalized epilepsies, including absence seizures. Hyperventilation may precipitate focal slowing in patients with an underlying structural lesion. Hyperventilation should not be performed in patients with severe cardiac or pulmonary disease, acute or recent stroke, severe cardiovascular disease involving large vessels, sickle cell disease or sickle cell anomaly of red blood cells. This test should also be used with caution during pregnancy.
Rice. 14. Assimilation of rhythm at a frequency of 20 Hz
recorded in leads P3-O1, P4-O2, T5-O1 and T6-O2
Rhythmic photostimulation normally causes the emergence of potentials that are clearly related to the time of appearance and frequency of intermittent light flashes; this phenomenon is referred to as rhythm acquisition. The answer depends on the background lighting and the distance from the light source to the patient. To optimize the stimulation effect, distances <30 cm from the patient are selected. The flashes of light are very short and the light stimulation is delivered sequentially at frequencies ranging from 1 to 30 Hz, each stimulus lasting approximately 10 s. It is possible to determine subharmonic and harmonic oscillation frequencies during light stimulation. Rhythm acquisition is usually observed in the occipital leads, at frequencies approaching the frequency of the α rhythm, with the eyes closed. The photomyoclonic (or photomyogenic) response is a frontal-dominant muscle artifact that occurs when flashes of light provoke repetitive local contractions of the frontal muscles (photomyogenic response). It is also possible to involve the periocular muscles with the appearance of single flashing light-induced head jerks (photomyoclonic response). Myogenic spikes appear 50–60 ms after the burst and increase in amplitude as the stimulation frequency increases. This response is considered normal, although it can be observed during withdrawal syndrome (abstinence) or in states of hyperexcitability.
Process of studying the results
The analysis of the results obtained is carried out in parallel during the procedure, and during the recording of indicators, and continues after its completion. When recording, the presence of artifacts is taken into account - mechanical movement of electrodes, electrocardiograms, electromyograms, and induction of mains current fields. The amplitude and frequency are assessed, the most characteristic graphic elements are identified, and their temporal and spatial distribution is determined.
Upon completion, a patho- and physiological interpretation of the materials is made, and on its basis an EEG conclusion is formulated. Upon completion, the main medical form for this procedure is filled out, called a “clinical electroencephalographic report”, compiled by a diagnostician based on the analyzed data from the “raw” recording.
The transcript of the EEG conclusion is formed on the basis of a set of rules and consists of three sections:
- Description of the leading types of activity and graphic elements.
- Conclusion after description with interpreted pathophysiological materials.
- Correlation of indicators of the first two parts with clinical materials.
The main descriptive term in EEG is “activity”, it evaluates any sequence of waves (sharp wave activity, alpha activity, etc.).
List of additional literature
- Aleksandrov M.V., Ivanov L.B., Lytaev S.A. [etc.]. Electroencephalography: manual / ed. M. V. Alexandrova. — 3rd ed., revised. and additional - St. Petersburg: SpetsLit, 2021. - 224 p.
- Abou-Knalil V., Misulis K.E. Atlas of EEG and Seizure Semiology. Butterworth Heinemann, Philadelphia, 2006: 1-213.
- Benbadis SR, Tatum WO Overinterpretation of EEGs and misdiagnosis of epilepsy. J. Clin. Neurophysiol. 2003; 20: 42-44.
- Blume WT, Masako K, Young GB Atlas of Adult Electroencephalography. 2nd ed. Lippincott Williams & Wilkins, Philadelphia, 2002: 1-531.
- Kellaway Peter. Orderly approach to visual analysis: elements of the normal EEG and their characteristics in children and adults. In: Ebersole JS, Pedley TA, eds. Current Practice of Clinical Electroencephalography. 3rd ed. Lippincott Williams & Wilkins, Philadelphia, 2003: 100-159.
- Markand, Omkar N. Pearls, perils, and pitfalls in the use of the electroencephalogram. Semin. Neurol. 2003; 23 (1): 7-46.
- Olejniczak P. Neurophysiological basis of EEG. J. Clin. Neurophysiol. 2006; 23 (3): 186-189.
- Tatum WO IV, Husain A., Benbadis SR, Kaplan PW Normal human adult EEG and normal variants. J. Clin. Neurophysiol. 2006; 23 (3): 194-207.
- Westmoreland BE Benign electroencephalographic variants and patterns of uncertain clinical significance. In: Ebersole JS, Pedley TA, eds. Current Practice of Clinical Electroencephalography. 3rd ed. Lippincott Williams & Wilkins, Philadelphia, 2003: 235-245.
Footnotes
- Adams AE Frequenzanalyse des flachen EEG I Dtsch. Z. Nervenheilk., 1968, Bd. 193., s. 57-72.
- Nebylitsyn V.D. Basic properties of the human nervous system. - M.: Publishing house of the Academy of Pedagogical Sciences of the RSFSR, 1966, 386 p.
- Saul LJ Davis H., Davis I'.A. Psychological correlations with the electroencephalogram / Psychosom. med., 1949, v. 11, p. 361-376.
- Friedl W., Vogel F. Geschlechtsunterschiede im normalen Ruhe-EEG bei jungen Erwachsenen / Z. EEG-EMG. 1979, Bd. 10, s. 70-79.
- Creutzfeldt OD, Arnold PM, Becker D. et al. EEG changes during spontaneous and controlled menstrual cycles and their correlation with psychological performance I Electroenceph. clin Neurophysiol. 1976, v. 40, No. 2, p. 113-131.
- Petersen I., Sorbie R. Slow posterior rhythm in adults / Electroenceph. clin. Neurophysiol., 1962, v. 14, p. 161 - 170.
- The term is used to describe the progressive increase in EEG voltage or the appearance of waves of increasing amplitude, often accompanied by a decrease in oscillation frequency during hyperventilation. Sometimes used to describe hyperventilation or the discharge of an attack. Use of the term is not recommended
- S. Gulyaev, I. Archipenko, A. Ovchinnikova. Electroencephalography in the practice of a neurologist. Saarbrücken: LAP, 2013. P. 64.
- S. Gulyaev, I. Archipenko, A. Ovchinnikova Electroencephalography in the practice of a neurologist. Saarbrücken: LAP, 2013. P. 64.
- S. Gulyaev, I. Archipenko, A. Ovchinnikova Electroencephalography in the practice of a neurologist. Saarbrücken: LAP, 2013. P. 65.
- S. Gulyaev, I. Archipenko, A. Ovchinnikova Electroencephalography in the practice of a neurologist. Saarbrücken: LAP, 2013. P. 65.
- S. Gulyaev, I. Archipenko, A. Ovchinnikova Electroencephalography in the practice of a neurologist. Saarbrücken: LAP, 2013. P. 66.