Complexes with this research
Monitoring of diabetes Monitoring of the condition of patients with diabetes (once every 6 months) RUR 1,900 Composition
Male anti-aging diagnostics Monitoring of key indicators in men aged 40+ RUR 13,300 Composition
Expanded anti-aging diagnostics in postmenopause Expanded monitoring of age-related changes during postmenopause RUB 29,230 Composition
IN OTHER COMPLEXES
- Anti-aging diagnostics in postmenopause RUB 12,630
- Advanced women's anti-aging diagnostics RUB 28,680
- Women's anti-aging diagnostics RUB 12,070
- Advanced male anti-aging diagnostics RUB 33,710
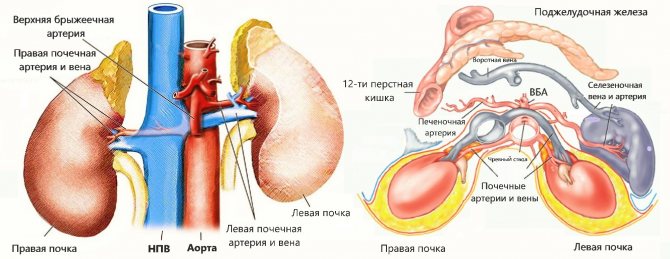
The structure of the kidney vessels
The renal arteries arise from the abdominal aorta just below the superior mesenteric artery - at the level of the second lumbar vertebra.
Anterior to the renal artery is the renal vein. At the hilum of the kidney, both vessels are located anterior to the pelvis. The RCA passes behind the inferior vena cava. The LPV passes through the “tweezers” between the aorta and the superior mesenteric artery. Sometimes a ring-shaped left vein is found, in which case one branch is located in front and the other behind the aorta.
Click on pictures to enlarge.
To study the vessels of the kidney, a 2.5-7 MHz convex sensor is used. The patient is positioned supine, the sensor is placed in the epigastrium. Assess the aorta from the celiac trunk to the bifurcation in B-mode and color flow. Trace the course of the RAA and LPA from the aorta to the renal hilum.
Drawing. In the CD mode, on the longitudinal (1) and transverse (2) sections, the RAA and LPA extend from the aorta. The vessels are directed to the gates of the kidney. Anterior to the renal artery is the renal vein (3).
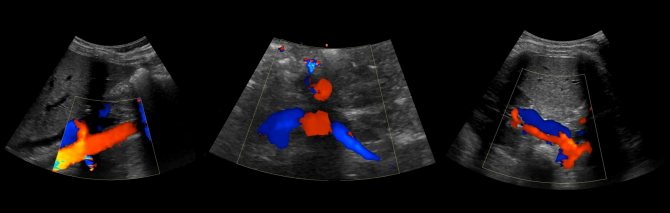
Drawing. The renal veins drain into the inferior vena cava (1, 2). The aortomesenteric “tweezers” may compress the left ventricular vein (3).
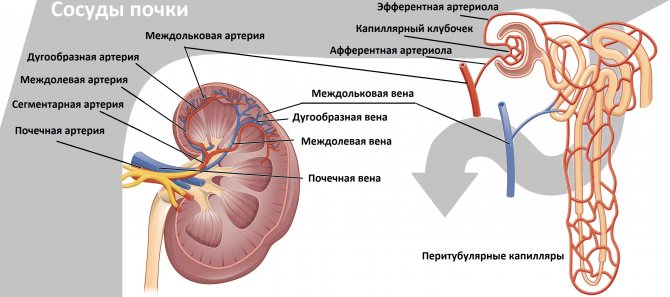
Drawing. At the hilum of the kidney, the main renal artery is divided into five segmental ones: posterior, apical, superior, middle and inferior. The segmental arteries are divided into interlobar arteries, which are located between the pyramids of the kidney. The interlobar arteries continue into the arcuate → interlobular → glomerular afferent arterioles → capillary glomeruli. Blood from the glomerulus drains through the efferent arteriole into the interlobular veins. The interlobular veins continue into the arcuate → interlobar → segmental → main renal vein → inferior vena cava.
Drawing. Normally, with CDK, the renal vessels are traced to the capsule (1, 2, 3). The main renal artery enters through the renal hilum; accessory arteries from the aorta or iliac artery may approach at the poles (2).
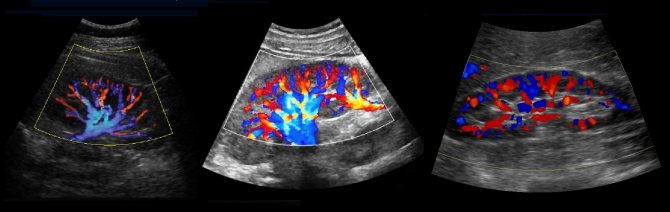
Drawing. Ultrasound of a healthy kidney: along the base of the pyramids (corticomedullary junction) linear hyperechoic structures with a hypoechoic track in the center are identified. These are arcuate arteries, which are mistakenly regarded as nephrocalcinosis or stones.
Video. Arc-shaped arteries of the kidney on ultrasound
Detailed description of the study
Normally, the human body maintains a balance of carbohydrate intake and consumption. This is largely possible due to the hormones of the pancreas - insulin (produced in the beta cells of the pancreas) and the hormone opposite to it in action - glucagon (produced in the alpha cells of the pancreas).
One of the main functions of insulin in carbohydrate metabolism is to normalize blood glucose levels. It carries out this function by transporting glucose into cells, the so-called insulin-dependent tissues, which are sensitive to its action and can receive glucose from the blood through special transporters (GLUT) only under the action of insulin. Insulin-dependent tissues include liver, muscle and adipose tissue.
In type 1 diabetes, the process of insulin formation is disrupted due to the destruction of pancreatic cells, due to which the level of glucose in the blood becomes excessive for the body. In type 2 diabetes, unlike type 1, insulin is produced in sufficient or sometimes in excess quantities (so-called hyperinsulinemia). This is due to the fact that the sensitivity of insulin-dependent tissues to the action of this hormone is reduced. As a result, they are unable to take up glucose from the blood, a condition called “insulin resistance” (IR).
Worsening tissue insulin resistance is clinically associated with overweight and obesity. Firstly, due to the fact that the number of GLUT receptors in overweight people is less than in people with normal body weight. Secondly, excess weight leads to pathological deposition of lipids (fat) in insulin target tissues, especially muscle and liver, leading to a toxic effect that impairs insulin action and impairs interaction with GLUT receptors.
A vicious cycle occurs - insulin resistance increases blood glucose levels, and glucose, in turn, increases the degree of insulin resistance. This condition often accompanies the so-called. prediabetes, and then accompanies diabetes mellitus. Prediabetes (prediabetic state) is a borderline condition characterized by impaired glucose metabolism, but its degree is not yet sufficiently pronounced for a diagnosis of diabetes mellitus. Without timely diagnosis and treatment, prediabetes can develop into diabetes mellitus.
To assess insulin resistance, the HOMA-IR index has been developed - a formula that takes into account the level of glucose and insulin - both indicators on an empty stomach. The insulin resistance index has greater diagnostic potential than glucose and insulin indicators separately. The higher the HOMA-IR value, the worse the tissue absorbs glucose and the worse the course of diabetes mellitus (or prediabetes).
Insulin resistance is also observed against the background of systemic diseases - atherosclerosis, coronary heart disease, etc. Also, a decrease in tissue sensitivity to insulin is observed in most patients with polycystic ovary syndrome or taking glucocorticosteroids, which can subsequently lead to diabetes.
Insulin resistance is often a component of metabolic syndrome, a condition characterized by obesity and impaired lipid and carbohydrate metabolism. In patients with metabolic syndrome, HOMA-IR helps evaluate the effectiveness of treatment.
The value of measuring the hepatic artery resistance index in the diagnosis of liver cirrhosis
Ultrasound scanner HS50
Affordable efficiency.
A versatile ultrasound scanner with compact design and innovative capabilities.
Introduction
Liver cirrhosis is caused by chronic necroinflammatory liver disease leading to fibrosis and nodular regeneration. The clinical consequences of cirrhosis develop as a result of a combination of impaired liver cell function, obstruction of bile flow and changes in hepatic blood flow with disruption of normal liver structure [1]. In liver cirrhosis, the increased amount of connective tissue leads to higher resistance not only to blood flow in the portal vein, but also in the hepatic artery [2]. Not every case of liver cirrhosis exhibits its typical sonomorphological signs, such as narrow hepatic veins, regeneration nodules and an uneven surface [3]. The introduction of color and duplex Doppler studies makes the identification of the hepatic artery and its hemodynamics an accessible non-invasive study for the diagnosis and monitoring of liver cirrhosis and portal hypertension [4]. The total volume of hepatic blood flow is approximately 1.5 liters per minute. The portal veins supply approximately 75% of the blood, while the hepatic arteries supply only 25%. The development of cirrhosis affects hemodynamics [5]. Calculation of the hepatic artery resistance index can provide an indirect characteristic of blood flow in the hepatic artery and direct information about hemodynamic changes in the vascular bed of the hepatic parenchyma [4].
Materials and methods
We studied 100 patients admitted to the Department of Liver and Biliary Pathology of the Faculty of Medicine of the University of Alexandria. Biopsy-proven cirrhosis was diagnosed in 55 patients. Diagnosis of cirrhosis using a combined clinical examination, laboratory methods and ultrasound data was carried out in 36 patients. In the latter, it was impossible to perform a liver biopsy due to an increase in prothrombin time or the patients’ refusal to do this procedure. Nine patients were excluded from the analysis of the results because a clear waveform of blood flow in the hepatic artery could not be obtained.
First, the hepatic artery was located using color flow mapping, then pulsed Doppler was used to clearly assess the waveform of the blood flow. The interrogating volume was placed into the lumen of the hepatic artery just before its bifurcation into the main right and left branches.
The resistance index (RI) was calculated using the maximum systolic velocity A and maximum diastolic velocity B as follows [6]:
IR = (A - B)/A.
The diameter of the hepatic artery was also measured. As a control group, 20 volunteers with normal liver function and normal liver ultrasound findings were examined. A clear waveform of hepatic blood flow was obtained in only 17 people from this group.
results
In the group of patients with liver cirrhosis, including 73 men and 27 women, the average age was 49.6 years; the youngest was 28 years old and the oldest was 64 years old. The average age of the control group, which included 14 men and 6 women, was 45.3 years. In the groups of patients and healthy people there were no differences in the hepatic artery resistance index by age and gender. The resistance index in the control group was 0.62, while the average value of the resistance index in the cirrhosis group was significantly higher - 0.76 (p < 0.0001). In patients with established cirrhosis, there was no significant increase in the resistance index compared to patients with early stage cirrhosis. Portal vein thrombosis was diagnosed in 11 patients and reverse flow in 5; The average resistance index in these two groups was 0.80, with no significant differences between the first and second, but it was significantly higher than in the group of patients with cirrhosis without portal vein thrombosis or reverse blood flow.
Using a cutoff rate greater than 0.70, the resistance index had a sensitivity of 66, a specificity of 67, and an accuracy of 68%. The average diameter of the hepatic artery in the control group was 2.5 mm, while in patients with cirrhosis it exceeded 4.5 mm, i.e. There was a significant dilatation of the hepatic artery (p<0.001).
Discussion
Ultrasound signs of liver cirrhosis are: changes in the hepatic echostructure, the presence of nodes, enlargement of the caudate and reduction of the right lobe of the liver, as well as the presence of indirect signs such as portal hypertension, splenomegaly, the appearance of collaterals and ascites. Detection of hemodynamic changes in the hepatic vascular bed in cirrhosis may be another sensitive sign that helps in the diagnosis and prognosis of cirrhosis. Devices with the capability of highly sensitive color Doppler examination allow mapping of the hepatic artery along its entire course. In patients with cirrhosis, its diameter increases, which facilitates locating. In the present study, the average diameter of the hepatic artery of patients with cirrhosis exceeded 4.5 mm, while in the control group it was only 2.5 mm. Color Doppler examination primarily helps in the diagnosis of dilatation of the hepatic artery and its differentiation from the dilated common bile duct.
Rice. 1.
A group of dilated convoluted capillaries, like channels, at the porta hepatis, representing a large cavernous transformation of the portal vein.
Rice. 2.
Complete thrombosis of the portal vein with an echogenic “old” thrombus in its distal two-thirds and a “recent” thrombus of lower echogenicity in its proximal third.
It appears that the hepatic artery dilates to increase blood flow into the hepatic parenchyma and to compensate for the decrease in portal blood flow. Vassiliades et al. (1993) showed that the diameter of the hepatic artery in patients with cirrhosis is 0.64 ± 0.06 mm. Leen et al. (1993) demonstrated an increase in blood flow through the hepatic artery in patients with cirrhosis, indicating a redistribution of blood flow between the portal vein and the hepatic artery. Moreover, the dilated hepatic artery may be the starting point for the development of portal vein thrombosis or reverse portal blood flow. The resistance index was chosen due to its independence from errors arising from incorrect selection of the Doppler scanning angle, which is especially important for the hepatic artery, which usually has a tortuous course, and selecting the angle of the sensor parallel to its lumen is not an easy task.
Rice. 3.
Partially reversed blood flow in the portal vein during exhalation is called “partial hepatofugal flow.”
Rice. 4.
Variants of the image with different courses of the normal hepatic artery.
Visualizing the hepatic artery and obtaining a clear Doppler recording of blood flow in it takes time. In addition to known normal anatomical variations, the presence of ascites, gas in the abdominal cavity, lack of cooperation with the patient (who cannot hold his breath for a sufficient period of time), and obesity may be obstacles to the examination of the hepatic artery. In the present study, the resistance index could not be calculated in 9 patients and 3 members of the control group due to the difficulty of obtaining a clear Doppler spectrum or even the impossibility of locating a normal hepatic artery, especially in healthy individuals.
Rice. 5.
Normal blood flow waveform with normal IR=0.6.
In the present study, there was no significant correlation between the severity of cirrhosis and the hepatic artery resistance index, which was previously shown by Vassiliades et al. (1993). However, there is a significant increase in the hepatic artery resistance index if cirrhosis is accompanied by portal vein thrombosis or reverse flow. In a study of hepatic artery resistance in cirrhosis with and without portal vein thrombosis, Saccrdoti et al. showed that the resistance index in cirrhosis without portal vein thrombosis is 0.71 ± 0.07, while in patients with cirrhosis with portal vein thrombosis it is 0.81 ± 0.06.
Rice. 6.
The trunk of the celiac artery and its Y-shaped bifurcation into the hepatic and splenic arteries.
It appears that the pathophysiological mechanisms of increased hepatic artery resistance develop in parallel with the increase in portal resistance. The hepatic artery dilates to compensate for the increased resistance from its hepatic bed, which ultimately leads to increased blood flow, whereas in patients with liver neoplasms, particularly metastases, the hepatic artery dilates with increased blood flow to accommodate the increased blood supply required for low-resistance vascular bed of neoplasms. These data were clearly presented in the study by Leen et al. (1993) when studying changes in hepatic perfusion in patients with liver metastases in comparison with patients with cirrhosis.
Rice. 7.
Curved trunk of the celiac artery and curved hepatic artery.
The diameter of the hepatic artery increases in parallel with the increase in the average blood flow velocity in it, while the diameter of the portal vein increases as the average blood flow velocity in it decreases. Thus, a redistribution of hepatic perfusion occurs between the hepatic artery and the portal vein. In 1995, Joynt et al. published a study that showed a marked increase in hepatic artery resistance index in healthy people after eating, which was not observed in patients with severe liver disease. This may be because the resistance index is already increased in patients with cirrhosis, but Joynt et al. did not reveal changes in the diameter of the hepatic artery after eating.
Rice. 8.
The hepatic artery is dilated to 6 mm with a parallel course in relation to the portal vein. Increased blood flow through the hepatic artery with superimposed spectra of maximum systolic velocity. IR=0.71.
It should be emphasized that the use of color Doppler and pulsed Doppler to measure hepatic artery resistance index is a reliable, relatively simple and sensitive non-invasive method that increases the possibility of diagnosing cirrhosis. A dilated hepatic artery may be an initial clue to the diagnosis of portal vein thrombosis or flow reversal when there is also a significant increase in the hepatic artery resistance index. The resistance index identifies and explains the redistribution of blood flow between the portal vein and the hepatic artery in liver cirrhosis.
Literature
- Herlong H, Andrew S. Cirrhosis. In: Pitt. HA, Feirucci J, eds. Hepatobiliary and pancreatic disease. Boston: Little, Brown and Company 1995: 3-30.
- Becker D, Gunter E, Seutter F. The hepatic artery resistance index: Distinction of cirrhotic livers from non-cirrhotic livers. Abstract. The American Association for the Study of Liver Diseases. Gastroenterology 1995; 108: 1021-71.
- Ralls P.W. Color Doppler sonography of the hepatic artery and portal venous system. A/R1995:155:517-25.
- Goncalvesova E, Kovac A. Color Doppler sonography in the diagnosis of portal hypertension in patients with liver cirrhosis. Abstract: The 2nd World Congress of International Hepatopancreaticobiliary Association, Bologna, Italy, 1996.
- Cioni G, Tincani E, Cristani A. Does the measurement of portal flow velocity have any value in the identification of patients with cirrhosis at risk of digestive bleeding? Liver 1996; 16: 84-87.
- Piscalgia F, Zironi G, Siringo S. US Doppler investigation of hepatic artery hemodynamics in liver cirrhosis and chronic active hepatitis. Abstract. The 30th Annual Meeting of the European Association for the Study of the Liver, Copenhagen, Denmark, 1995.
- Vassiliades VG, Ostrow TD, Chezmar JL, Hertzler GL, Nelson RC. Hepatic arterial resistive indicators: correlation with the severity of cirrhosis. Abdom Imaging 1993; 18: 61-65.
- Saccrdoti D, Merkel C, Bolagluesi M, Amodio P, Augeli P, Gatta A. Hepatic arterial resistance in cirrhosis with and without portal vein thrombosis: Relationships with portal hemodynamics. Gastroenterology 2995:108:1152–1158.
- Bolandi L, Libassi S, Gaiani S, Zironi G, Benzi G, Sauti V, Barbara L. Liver cirrhosis: changes in Doppler Waveform of Hepatic Veins. RAD 1991;178:513-516.
- Leen E, Goldberg [A, Anderson JR, Robertson J, Moule B, Cooke TG, Me Ardle CS. Hepatic perfusion changes in patients with liver metastasis: Comparison with those patients with cirrhosis.Gut 1993;34:554-557.
- Joynt LK, Plott JP, Rubin JM, Ellis JH, Bude RO. Hepatic artery resistance before and after standard meal in subjects with diseased and healthy livers. RAD 1995;196:489-492.
- Pierce MF, Swwell R. Identification of hepatic cirrhosis by duplex Doppler ultrasound value of the hepatic artery resistive index. Australs Radiol 1990;34:331-333.
Ultrasound scanner HS50
Affordable efficiency.
A versatile ultrasound scanner with compact design and innovative capabilities.
Doppler of renal vessels is normal
The normal diameter of the renal artery in adults is 5 to 10 mm. If the diameter is <4.65 mm, an accessory renal artery is likely present. When the diameter of the main renal artery is <4.15 mm, an additional renal artery is almost always present.
The renal artery should be assessed at seven points: at its exit from the aorta, in the proximal, middle and distal segments, as well as the apical, middle and lower segmental arteries. We evaluate peak systolic (PSV) and end-diastolic (EDV) blood flow velocities, resistivity index (RI), acceleration time (AT), acceleration index (PSV/AT). See Vascular Doppler for more details.
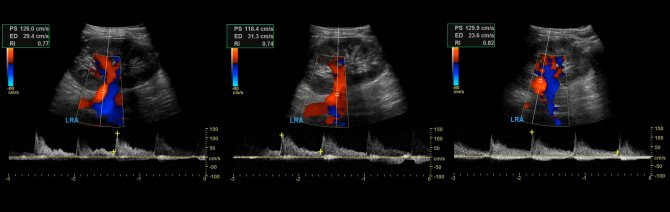
The normal spectrum of the renal arteries has a pronounced systolic peak with antegrade diastolic flow throughout the cardiac cycle. In adults, the normal PSV on the main renal artery is 100±20 cm/sec, EDV is 25-50 cm/sec, in young children PSV is 40-90 cm/sec. In segmental arteries, PSV drops to 30 cm/sec, in interlobar arteries to 25 cm/sec, in arcuate arteries to 15 cm/sec and interlobular arteries to 10 cm/sec. RI at the renal hilum <0.8, RI at the intrarenal arteries 0.34-0.74. In a newborn, RI on the intrarenal arteries reaches 0.8-0.85, by 1 month it drops to 0.75-0.79, by 1 year to 0.7, in adolescents 0.58-0.6. Normal PI is 1.2-1.5; S/D 1.8-3.
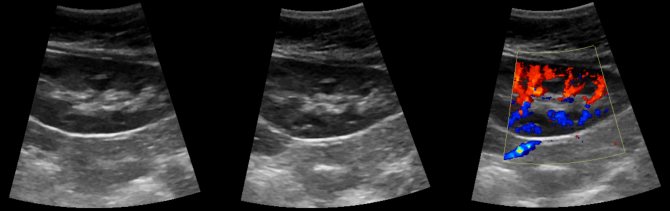
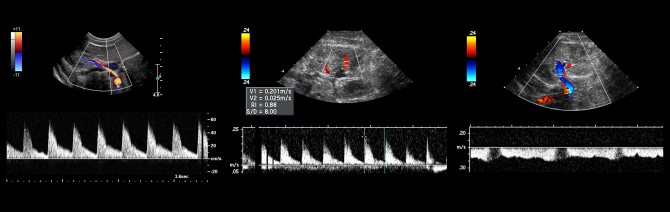
Drawing. The normal spectrum of the renal arteries is high systolic peak, antegrade diastolic flow, low peripheral resistance - RI is normal <0.8.
Drawing. The spectrum of renal vessels in newborns: renal artery - pronounced systolic peak and antegrade diastolic flow (1); high resistance in the intrarenal arteries is considered normal for newborns - RI 0.88 (2); renal vein - antegrade flow with a constant speed throughout the entire cardiac cycle, minimal respiratory fluctuations (3).
Doppler of renal veins
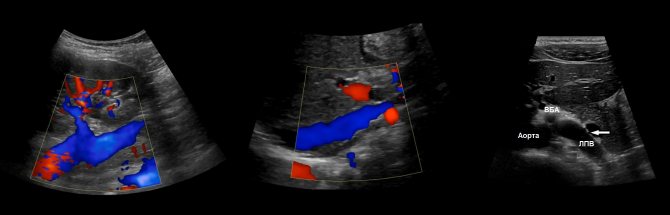
The left renal vein passes between the aorta and the superior mesenteric artery. The aortomesenteric “tweezers” can compress the vein, leading to venous renal hypertension. In a standing position, the “tweezers” compress, and in a lying position, they open. With Nutcracker syndrome, outflow through the left testicular vein is difficult. This is a risk factor for the development of left-sided varicocele.
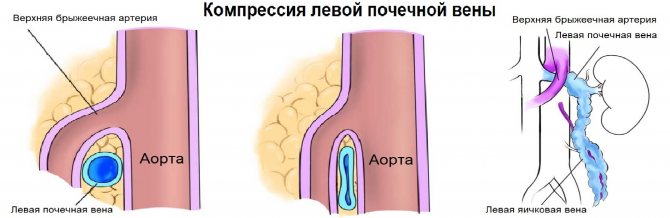
Due to compression, the spectrum of the left vein is similar to the portal vein - spectrum above the baseline, constant low speed, contour in smooth waves. If the ratio of the diameter of the left vein in front of and in the narrowing zone is more than 5 or the flow rate is less than 10 cm/sec, we conclude that the venous pressure in the left kidney is increased.
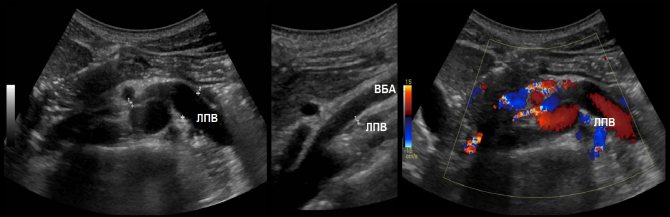
Task. On ultrasound, the left renal vein is dilated (13 mm), the area between the aorta and the superior mesenteric artery is narrowed (1 mm). Blood flow in the area of stenosis at high speed (320 cm/sec), reverse blood flow in the proximal segment. Conclusion: Compression of the left renal vein by aortomesenteric “tweezers” (Nutcracker syndrome).
Compression of the renal vein is possible due to its abnormal location behind the aorta. The diameter ratio and flow rate are evaluated according to the above rules.
The nature of the blood flow in the right renal vein approaches that of the caval vein. The shape of the curve changes when you hold your breath and can be flatter. Blood flow speed is 15-30 cm/sec.
Take care of yourself, Your Diagnosticer !
Tags: Doppler lectures kidneys ultrasound